During my day job, visualizing our development progress is very helpful for the team. Personally, I am not good at choosing which way to visualize this data, but once seen, I understand the value of them. We recently acquired a project manager for the team. He spent time creating charts of our sprint progress by hand, almost every day. While these charts were very useful and telling, my engineering brain could not let go of the fact that we should be able to see this, anytime, with any teams data. So I made it.
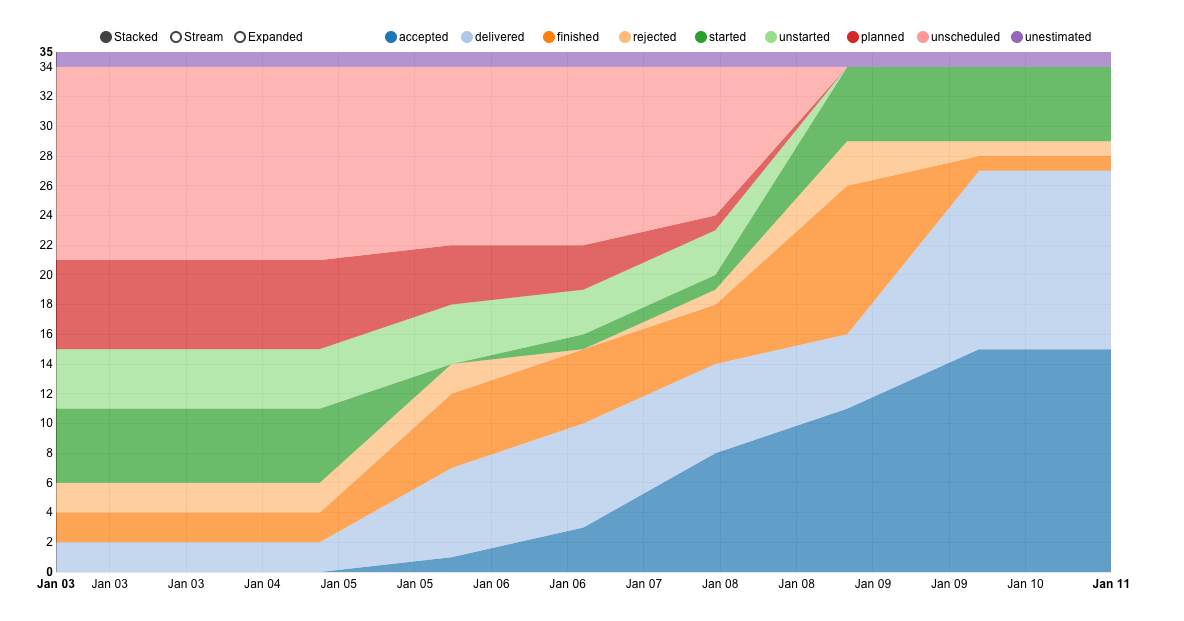
I have started with only one graph. But I believe it is a important graph to have. It shows the progress of sprint stories over time. Our developers use it on a daily basis, during our stand ups. The project managers have been the key user of this project and have been very helpful. They can instantly find ways to make it more useful for them and the team.
Enough backstory, lets talk code.
Development
We use Pivotal here to track our stories (bugs, chores, features...) and they have a pretty decent API. I had used their API on many other occasions creating internal apps for our team. But this project seemed to be begging to be open source. I generalized the data gathering and processing as much as I could. The filters in the app itself should work for any team. I stuck to a node app for ease of development, since I had already written a module for the Pivotal API. I got lots of practice with the use of underscore chaining for data processing. By finding the ways to filter/map/group your data, you can truly make your code pretty and easy to understand. The difficult part was actually transforming the data to work with the chart library. By the way, if anyone can see a better way to transform the data, please let me know! The charting library I used was a powerful tool, but hard to find documentation for. I believe the project owner has switched/forked a few times.
Future
I believe this project can be expanded upon in a big way. I am sure many other teams have their own favorite graphs. I would love to see the community help add those graphs. I plan on making a "dashboard" index page to show off all the graphs we currently manage. This is of course limited to teams who use Pivotal, but even that may be generalized out one day...
Here is the Github project: https://github.com/dijs/pivotal-charts